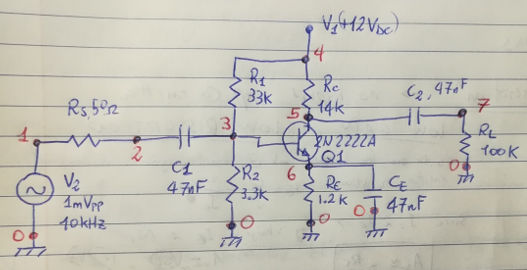
We run a transient simulation with the "tran" command, specifying the timestep and the final time. Then we plot the voltage at nodes 7 (the output of our ampli) and at node 2 (the input). Here is the code (write it in a file "ampli.net" and, in GNU/Linux, call it with "ngspice file.net").
** Asterisk denotes a comment.
**
**
** DC Voltage source:
** Vn  PLUS_NODE  MINUS_NODE  VOLTAGE
**
** AC Voltage source (amplitude is Vpp/2):
** Vn  "PLUS"  "MINUS" SINE(offset  amplitude  frequency  delay  theta_damping_factor)
**
** Resistor: (use "100K" for 100 kOhm)
** Rn  NODE  NODE  VALUE
**
** Transistor:
** Qn  collector_NODE  base_NODE  emitter_NODE   NAME
**
*** Start by the title of this file:
Simple ampli

*** Model for the transistor (find it online)
.MODEL 2n2222a  NPN (IS=2.20f NF=1.00 BF=240 VAF=114
+ IKF=0.293 ISE=2.73p NE=2.00 BR=4.00 NR=1.00
+ VAR=24.0 IKR=0.600 RE=0.194 RB=0.777 RC=77.7m
+ XTB=1.5 CJE=24.9p VJE=1.10 MJE=0.500 CJC=12.4p VJC=0.300
+ MJC=0.300 TF=371p TR=64.0n EG=1.12 )

*** Write the connections here
V1 node4 0 12
V2 node1 0 SINE(0 0.001 10000 0 0)
Rs node2 node1 50
C1 node3 node2 47n
R1 node4 node3 33K
R2 node3 0     3.3K
Rc node4 node5 14K
Re node6 0     1.2K
Ce node6 0 47n
C2 node7 node5 47n
Rl node7 0 100K
Q1 node5 node3 node6 2n2222a

*** Here some commands to be executed
.control
tran 0.000001 0.001
plot node5 node7
.endc

.end
Example 4: RC filter - AC small signal analysis
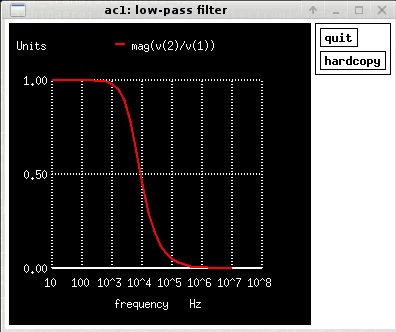
SPICE can do a lot more cool stuff. For example it can do small signal AC analysis. We can simulate the transfer function of a circuit, such as the simple low-pass filter shown below.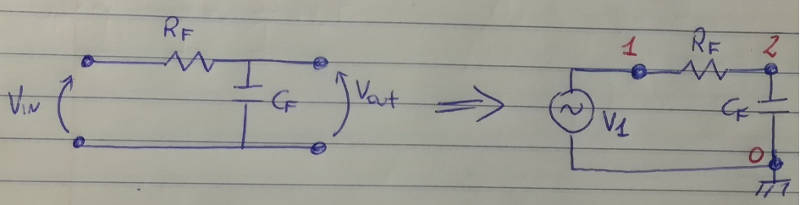
The netlist for this circuit is:
Low-pass filter

VS  1  0  AC  1  SIN(0  1  2KHZ)
R1  1  2  1K
C1  2  0  0.032UF

.control
ac   dec 5 10 10MEG
plot mag(v(2)/v(1))
.endc

.end
SPICE will basically overwrite the voltage source, applying a frequency from 10 Hz to 10MHz, placing 5 points per decade.
Note that the AC small signal analysis in SPICE starts with a DC analysis to find the DC bias.
This is done automatically, without requesting it explicitly.
To plot the magnitude of the transfer function, you can compute the ratio of the output and input voltages, then compute the module (magnitude):
plot mag(v(2)/v(1))
CAVEAT: capacitors in series and DC analysis
Something important here: in some versions of SPICE, such as "ngspice", if you try to put two capacitors in series and launch a DC or a transitory analysis, the computation may crash. Indeed, the problem of finding the voltage between two capacitors in series, is ill posed for a purely DC calculation. Most SPICE flavors automatically put a large resistor in parallel to the capacitor. As far as I know, ngspice does not do it, so you should do it yourself. If you have capacitors in series, put a 100G resistor in parallel to each of them, and you'll be fine.Plotting transistor characteristic curves
So, don't you hate when a datasheet does not show the characteristic curves of a transistor? Actually (assuming your SPICE transistor model is accurate enough), you could plot them using spice! I'm sure there is a good way to do it directly withing spice, anyway click here for an Octave script that does it.The result is something like this:
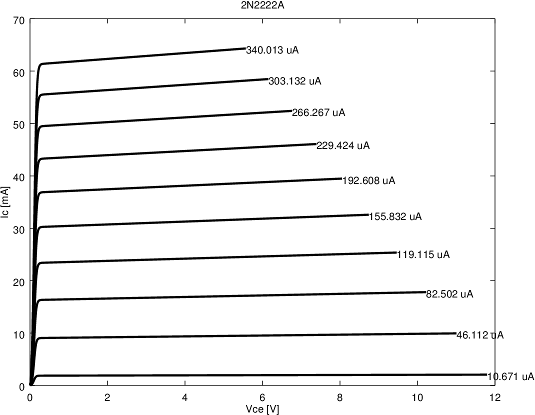
The way this is done is by setting up a circuit like below. There are two generators. The V1 generator is fixed to a value and the DC value near the base is swept from 0 to some volts, saving the resulting (1) base current, (2) collector current and (3) collector-emitter voltage. This is repeated for various values of V1 from some 0 to 12 V. Here is the circuit:
Cheers,
Stefano
Back to Homepage